All guides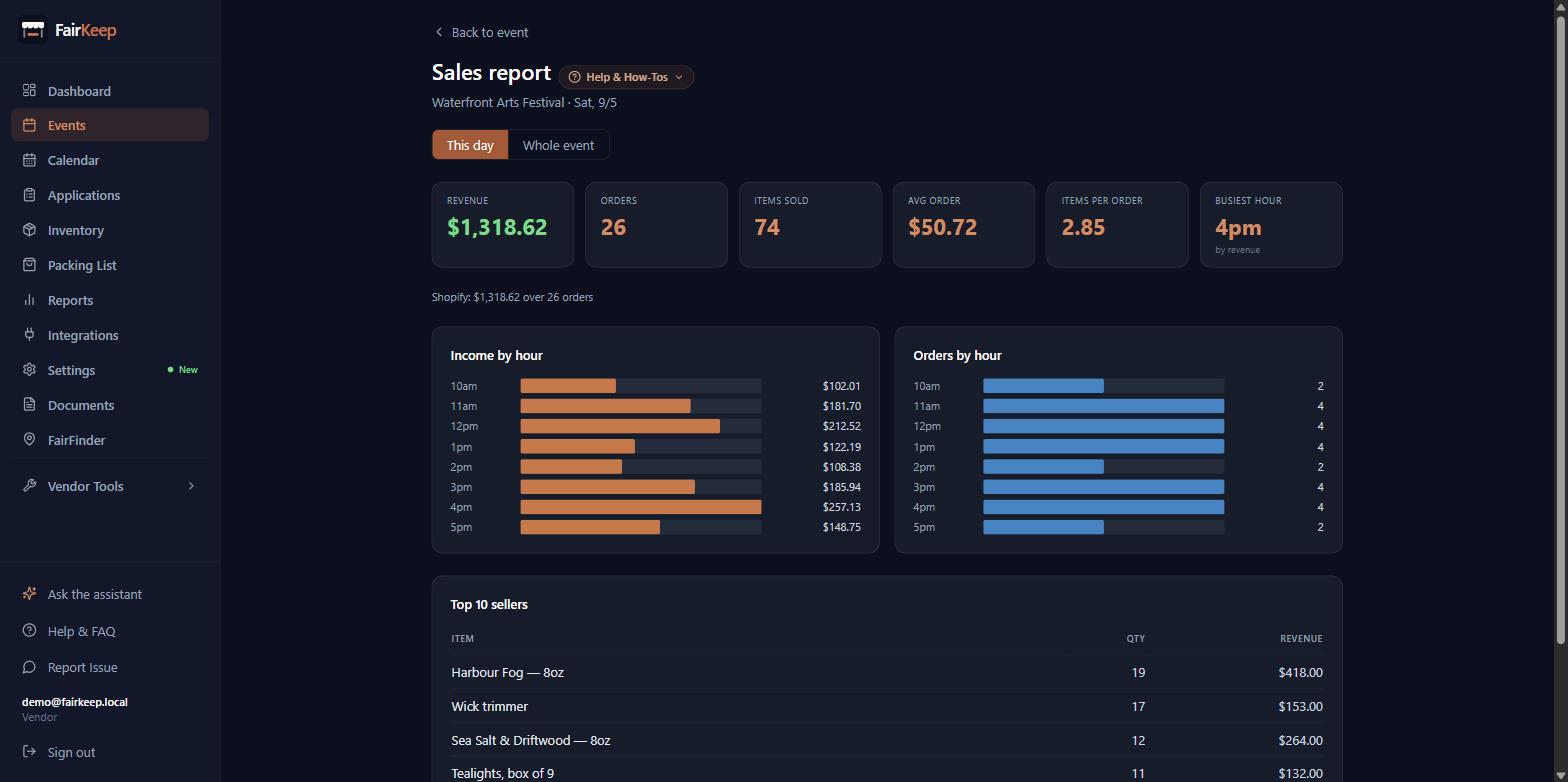
Tools & Integrations
See what sold at a market, and when
A per-event sales report: top 10 sellers, the busiest hours, and per-day totals for a multi-day show.
- 1Open the event and click "Sales Report" at the top of the page.
- 2It opens on "This day". Switch to "Whole event" for a multi-day show — The Big E is stored as one event per day, so a single day is only ever 1/17th of the fair.
- 3The top row is the summary: revenue, orders, items, average order, items per order, and the hour that took the most money.
- 4INCOME BY HOUR and ORDERS BY HOUR are separate charts on purpose. Dollars and order counts are different scales, and putting them on one chart with two axes can make any two lines look related.
- 5On "Whole event" both hourly charts show an AVERAGE PER DAY, not a total. Seventeen days added together would just be a bigger number; the average is what tells you to put a second person on the till at 1pm.
- 6The hourly average only counts days that actually had a sale in that hour, so a show that ran late on two Saturdays is not dragged down by fifteen days that closed earlier.
- 7"Revenue by day" appears on a multi-day run, with the best day called out underneath.
- 8ON A MULTI-DAY SHOW, "This day" also compares against the day before it. The headline says whether you are up or down, and the previous day appears as a second, dimmer bar under each hour.
- 9The comparison is LIKE-FOR-LIKE while the show is still on: at 2pm it measures yesterday only up to 2pm as well. Comparing four hours of trade against a full twelve would report a collapse every morning.
- 10The chart still shows the previous day IN FULL, so you can see the trade that is still ahead of you. Where the two differ, the line underneath says what yesterday finished on.
- 11The previous day means the day before in THIS run, not yesterday on the calendar — a fair that skips a Monday compares against the Sunday, not against a day it was shut.
- 12Top sellers merge Shopify and Square on the product name. The same item named differently in each system will appear twice — rename one to match if you want them combined.
- 13These are the sales your registers rang up and FairKeep attributed to the event. That is NOT the same as the Income box on the event, which you can type yourself. The two can differ, and the page says so.
- 14Nothing showing? The event needs POS devices linked to it. See "Track Shopify POS revenue per event" — a day with no register attached has no sales to attribute.
- 15Crew members cannot open the sales report. Crew never see sales or money, not even on the shows they work.
Related guides
Track Shopify POS revenue per event
Name your Shopify POS devices, link them to events, and see exactly which register earned what at each market.
Save a Shopify report, and link it to a show
Name a set of dashboard filters so it is one click away — and pin it to a multi-day show so the whole run pulls as one set of stats.
Track your first event
Learn how to log an event in FairKeep — from entering the show details before the event to filling in income and expenses afterwards.